
By Linda Conner Lambeck
Westport–Not all use of technology is equal.
A lot depends on the grade, the subject and even who you ask.
Those are some of the key findings of a screentime audit conducted this spring by the school district.
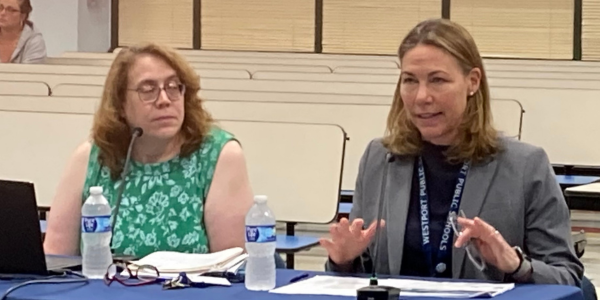
As the school board bans school-time cellphone uses and proceeds with caution into its use of artificial intelligence in the classroom, the study results, presented to the school board on Thursday, are to be used as a baseline for future district research.
“Not only did we get a lot of good information,” said Anna Mahon, assistant superintendent for teaching and learning, “but … the entire process afforded us the opportunity to reflect on the information and start asking questions.”
Next steps will be to set grade appropriate AI guardrails for screentime use in school and work to strengthen family confidence and trust in the district’s focused technology use.
The audit
The study focused on individual student use of devices rather than shared displays or lessons presented on classroom Smartboards.
There were three components:
a perception survey for students in grades 3–12, parents and district staff.
a quantitative analysis of student devices and network activity during the school day.
a curriculum-based review completed by coordinators and teachers to distinguish required and discretionary screen use within the curriculum and for homework.
Schools Superintendent Thomas Scarice said the audit is so unique that Hanover, the research firm used by the district to help with the survey, wants to trademark it.
The survey
The survey got 4,404 respondents.
Generally, those answering the survey called the amount of technology used for school-related purposes “appropriate.”
Students and staff had a more favorable view than parents. While 80 percent of students and 75 percent of staff called the use of technology “about right,” 61 percent of parents did.
More concern was expressed about “overall” screen use than school-related tasks.
A slight majority–53 percent of staff and 52 percent of parents–said students spend too much time using technology overall.
What is the ideal amount of time? The sweet spot for most respondents, Mahon reported, is one to two hours a day.
To district officials the results suggest that the community does not reject instructional technology, but wants screen time to be purposeful, developmentally appropriate, and balanced with non-screen learning.
Quantitative usage findings
To determine how much screentime there actually is in school, the district looked at Chromebook usages of a random but statistically significant sample of students in the elementary and middle schools and network data at the high school where students bring their own device, according to Natalie Carignan, the district’s director of technology.
The K-8 data was collected during two full weeks in December and January. The high school data was collected during the start of the second semester.
Not surprisingly, average daily screentime use among K-8 students increased as students moved into higher grades. Kindergarten students averaged 2.2 minutes a day on devices. By grade 8 it was 69.4 minutes per day.
In most cases, the K-8 use occurred on district approved academic platforms, including Google tools and research platforms. Another commonly used platform was ClassLink, a dashboard students use to access instructional and web-based information systems.
The audit found that most K–8 internet activity occurred during the morning instructional block, declined around lunch, and rose again before dismissal.
Officials say that pattern helps to distinguish between valuable and necessary instructional usage and discretionary or avoidable usage.
There will be follow up conversations with teachers as a result.
Board member Abby Tolan said she found it interesting that usage seemed higher on Fridays than on other days of the week.
Board member Jill Dillon said she has maintained for some time that devices were being used unnecessarily at transition and dismissal times.
At Staples High School, network activity was detected mostly on district-sanctioned academic and creative tools like Adobe and Google Docs, but also on platforms such as Grammarly and Instagram, which are not approved for student use at school.
Carignan told the board that most likely, students coming to school with their own devices don’t first log off those sites. Students at school may not browse those sites but district tracking devices still pick up the signal as background internet traffic, Carignan said.
Curriculum Review Findings
In the third part of the study, district curriculum coordinators looked at written instructional units for required in-school or homework and estimated the amount and type of screen time currently involved.
The review showed that screen time is not evenly distributed across grade levels or disciplines.
At the elementary level, the review found that the math curriculum does not require students to use a one-to-one device, though some teachers use it for practice assignments or assessments.
In literacy at the elementary level, digital resources are used for resources and in some cases to type research papers. Devices are also used for intervention tools such as Lexia.
In secondary mathematics, screen use is primarily associated with online practice, graphing tools, calculators, and technology-supported modeling.
Screen use in grades 6-10 English / Language Arts is concentrated around drafting, revising, typing, digital assessments, research, digital reading resources, and multimedia projects. Eighth graders use it to write essays. Much ELA screen time is tied to creating rather than consuming content.
In science, screens provide simulations, data analysis, and interactive tools allowing students to observe or manipulate phenomena that would otherwise be difficult, unsafe, invisible, or impractical to study directly.
“This represents some of the strongest instructional justification for screen use because the screen is not simply replacing paper but expands what students can investigate,” the study states.
In World Languages, digital tools are increasingly used for making recordings, podcasts, presentations, and multimedia projects. Social Studies uses technology for digital research, primary source analysis, map practice, current events, and presentation design. In health courses, screentime is used for research, source evaluation, public service announcements, and student-created advocacy materials. Physical education courses and most Visual and Performing Arts courses include little to no required screen time.
What now?
Mahon said the questions raised by the baseline data include how much screen time is required and how much is discretionary.
“The audit also shows that the quality of screen time matters as much as the quantity,” she said. “The district’s goal should be to reduce unnecessary or low-value screen time while preserving and strengthening uses that deepen learning.”
The data will be used to inform curriculum writing. It may also have budget implications, said Carignan. Instead of just gauging software value on screentime use, she will seek to find out how the tools are used.
Board Member Stephen Shackelford said he’d like district officials to offer examples of what is dropped because of the review.
With baseline data in hand, Mahon said the plan is to gather new statistics on an annual basis.

Linda Conner Lambeck
Linda Conner Lambeck covers education for Westport Journal. She was a reporter for more than four decades at the Connecticut Post and other Hearst publications. She has covered education throughout Fairfield and New Haven counties. She is a proud member of the Education Writers Association.


This Thursday’s June 18 Special Board of Education (BOE) meeting matters. Staples HS Cafeteria at 7pm
It was shared the sole agenda item will be the role the BOE will play in the comprehensive review of Special Education.
Show up and express what our kids deserve: a truly independent review — overseen by the BOE, not the administration — that confronts the real problems in Special Education head-on. Research. Best practices. The law. *Our most vulnerable kids are depending on it*
Here is a link to the change.org petition about the special education review; over 600 have already signed in support: https://c.org/WfTF6PjhCR